CT-Codeview & Analyzer …
In future, analysis and research in ABAP® source code will be easier, simpler, and more effective …==> Time-consuming searching, finding, and documenting are a thing of the past …
The ABAP® programming language is especially suitable for visualization. With the use of statements such as FORM, FUNCTION, METHOD, CLASS, DYNPRO, MODULE, CALL SCREEN, IF, LOOP, CASE, WHILE, DO, TABLE, a high degree of modularity can be achieved in the source code.
The graphical representation of ABAP programs provides a comprehensive overview of the coding and substantially supports the following IT areas:
- Quality control
- Production release
- Program documentation
- Process documentation
- IT audit
- Maintenance
- Second-level support
- Training and Education
- …
The Use of Certified Software = Secure Applications for Your Company…
Knowledge of the technical relationships, e.g. in the Repository, ABAP Dictionary, program/class library and of the base programs and system interfaces forms the basis for the substantive analysis and documentation of ABAP code. The prerequisite for developing our CT products is the considerable know-how and many years of experience (more than 30 years) of our development team.
The security of your company’s applications is supported by the certification of the CT-AddOn by the manufacturer of the ERP software. This certification confirms that interfaces are used correctly, that add-on functions are relevant to the process, and that technical implementation is correctly done. Your add-on product has undergone system integration tests within an ERP environment.
You receive an add-on product for which system integration tests have been carried out within your ERP environment. Certified software products significantly enhance your IT security.
Company compliance rules increasingly require the use of certified software, which has the additional advantage of simplifying regular system checks by internal or external auditing bodies, e.g. government tax audits, external audits, internal audits.
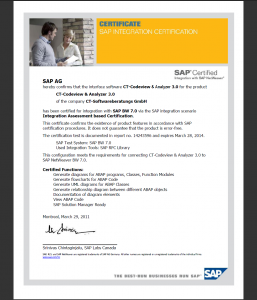
SAP SE certified the CT-Codeview & Analyzer 29.03.2011 [more …]
Application Areas of the CT-Codeview & Analyzer
1. Visualization of ABAP Program Code …
1.1 Source Diagramm …
1.2 Flow Logic Diagramm …
1.3 ER Diagramm …
1.4 UML Diagramm …
2. Process Documentation for ABAP Programs …
3. Record the Results of Analyses in Form-Driven Process Documentation …
4. Diagram Overview …
5. More Features of the CT-Codeview & Analyzer …
6. SAP® Integration …
7. SAP Certification …
8. Software Requirements …
9. Hardware Requirements …
1. Visualization of ABAP Program Code
It is can be hard to quickly get to grips with a large amount of source code …
… graphical representation of an ABAP program … says more than 1000 words …
Through the division of ABAP programs into definable code sections, effective analysis is enabled and your efforts to understand ABAP code that was programmed elsewhere are made significantly easier using a graphical represenation of the source code.
The advantages of automatic visualization of ABAP code are manifold:
- With the automated analysis, the routing of the program objects, and the visualization of the graph elements, you can display the current status as a program overview at any time.
- You can find out quickly about program changes (maintenance, modification, development) in the easy-to-interpret summary.
- To gain a better overview, you can adapt the complete visualization of an ABAP program to your requirements (e.g. tree = object list, symmetrical = large diagrams, hierarchy = left/right, pyramid = top/down).
- Structures that are not relevant for you can be hidden temporarily to reduce complexity.
- To make things simpler, you can store large program sections in sub-graphs, where you can analyze them more easily.
- At time of development of an ABAP program, you will find it useful to see a code visualization prepared at various different points of the development process.
- The regularly updatable graphical overview provides an improved insight into the program logic, the program structure, and the relationships between the various program elements. During generation, temporary ABAP syntax errors are ignored.
- Convenient print functions allow you to prepare high-resolution versions running across several pages of larger diagrams (e.g. as a presentation).
- …
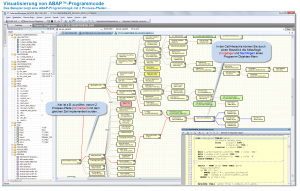
Screenshot: The example shows ABAP program logic with 2 process paths …
1.1 Source Diagram
The program objects of an ABAP program are analyzed and then routed through various algorithms. Subsequently, the graph elements are displayed. Analysis, routing, and visual representation are processed relatively quickly because the executing code is written using C++.
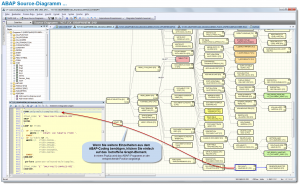
The source diagram is generated from CALL hierarchies (e.g. FORM, FUNCTION, or METHOD) and programming events (e.g. TOP-OF-PAGE, MODULE, or AT) from the selected ABAP program. To analyze external programm calls, for example, you can generate additional source diagrams in separate tabs.
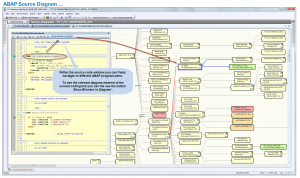
By double-clicking, you can navigate between the relevant position in the graphic and the source code to find out about the context in question.
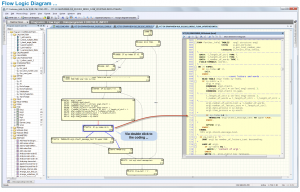
1.2 Flow Logic Diagram
Flow logic analysis enables the graphical representation of decision and processing structures such as IF, CASE, WHILE, and LOOP within ABAP source code. Using graphical functions, flow graphics shows which commands are processed under which conditions.
In a graphical representation, the result of a sequence of commands is easier to follow, and the program logic can be understood more quickly. The amount of time needed to understand ABAPprograms that were programmed by someone else is reduced (facilitating external programming – maintenance by the customer, vacation cover, IT quality assurance, for example).
By double-clicking, you can navigate between the graphic and the source code to find out about the context in question.
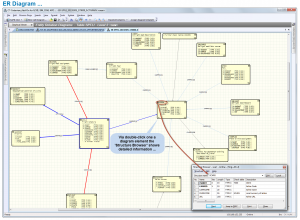
1.3 ER Diagram
The ER diagram (Entity Relationship Model) in CT-Assist enables the graphical representation of primary database tables and of the relationship to other database tables. The resolution (detail level) of the table relationships makes it easier to grasp interdependencies. The fundamental transparency of the table relationships is a prerequisite for most development tasks (programming and maintenance) in an SAP® technology context…
Double-clicking takes you to the structure browser and from there to the ABAP Dictionary.

1.4.UML Diagram
Starting with the current class, dependent classes are found and shown in a UML class diagram.
In UML notation, the various ABAP-OO classes are shown as boxes (with class names, methods, and attributes). ABAP-OO interfaces are also shown as boxes. They can be identified by the IF naming convention.
By double-clicking, you can navigate directly to the relevant source code. The source code for the class selected in the graphic is shown in context, so that you can find out what you need to know about adjoining sections of code.

2. Process Documentation for ABAP Programs …
The benefits of process documentation for ABAP programs are frequently underestimated.
Commercial IT practice shows that many ABAP programs are repeatedly analyzed and evaluated by different developers or consultants (for purposes of maintenance, error analysis, performance optimization, for example). To prevent work being duplicated, the results of such analyses should be documented in a suitable way at the earliest possible point in time in a process description.
Conclusion:
Process documentation turns temporary findings into real and permanent information objects.
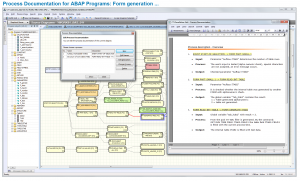
Example: Selecting a process chain ( form generation => figure 3 …)
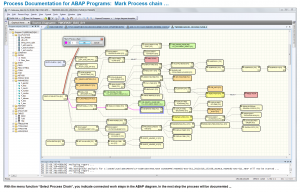
With the menu function “Select Process Chain”, you indicate connected work steps in the ABAP diagram.
3. Record the Results of Analyses in Form-Driven Process Documentation …
Some advantages of form-driven process documentation::
- The form-driven process documentation resulting from the CT-Codeview ensures that the results of analyses are recorded in a standardized representation.
- The process flow in the ABAP source diagram is determined by IT analysts by appropriate selection of the various program objects (e.g. FORM, METHOD, FUNCTION CALL, and so on).
- Based on this process chain, the documentation form is generated, the process elements to be documented are created, and the documentation objects are predefined.
- Full documentation of a process chain and the associated objects is thus as good as guaranteed.
Conclusion:
The methodical procedure for analysis and documentation of process chains reduces development and maintenance work.
… … Any program analysis taking place at a later point in time can benefit from the existing process documentation.
Example: Form generation (by selecting a process chain)
4. Diagram Overview…
Even ABAP programs with a average level of complexity can have 300 to 500
program objects or more (e.g. DYNPRO, TABLE, FORM, FUNCTION, METHOD, or MODULE).
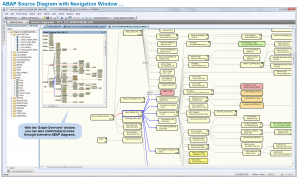
In addition to the main diagram, you can use an overview window that takes the form of a popup. Here, you can move freely, as if with a magnifying glass in any direction across the complete program visualization.
… get to grips with the source diagram and with the program logic more quickly.Visualization of ABAPcode is particularly useful in the following IT scenarios:
- Maintenance
- Customer-specific ABAP developments
- Reengineering
- Vacation cover, new appointments/employees assume different responsibilities
- Fast correction of errors
- Improved support of team work
5. More Features of the CT-Codeview & Analyzer
- Visualization of ABAP modularization units in graph elements (program, transaction, function module, function group, class)
- Graphical representation of more than 20 different visualization objects (FORM, PERFORM, CALL FUNCTION, CALL METHOD, DYNPRO, MODULE, TABLE, CALL SCREEN, AT, TOP-OF-PAGE, END-OF-PAGE, INITIALIZATION, GET, etc.)
- Routed representation of static relationships of visualization objects (e.g. “who was called by whom with what frequency”)
- Interactive, alternating assignment of graph elements to the respective source code (double-click to navigate from a visualization object to the code itself or vice versa)
- Segmentation of extensive, complex programs (e.g. those with more than 1000 visualization objects) using “Hide and new sub graph”
- More than 30 visualization templates present the relevant ABAPTM source code in various graphic representations
- Hide feature for selected elements (blending out of objects)
- Several layouts for the representation of different elements (tree structure, hierarchical layout, symmetrical representation, circular layout)
- Object tree in separate window via double-click
- Export of the graph representation to Enhanced Meta Format [emf] (for documentation purposes or for further processing in Microsoft® Word®)
- Graph overview window, zoom throughout the whole display, search function, control of visualization objects, parameter setting function for display of the objects, etc.
6. SAP® Integration
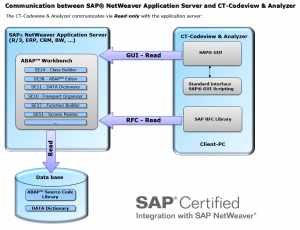
Communication between the ‘CT-Codeview & Analyzer’ and the application server is realized exclusively using certified standard interfaces of the company SAP SE, Walldorf. The CT-Test & Optimizer is suitable for the following SAP® systems: R/3® from Release 3.x to 4.7 inclusive (Enterprise), mySAP™ ERP, mySAP™ CRM, SAP® BW, and all other components that are based on SAP® NetWeaver® systems (up to 7.3).
The add-on has a modern, ergonomic user interface and effective support for tasks. Installation generally takes about 5 minutes.
7. SAP Certification
SAP SE certified the software solution ‘CT-Codeview & Analyzer’ 29.03.2011:
Certified Functions:
- Generate diagrams for ABAP programs, Classes, Function Modules
- Generate flowcharts for ABAP Code
- Generate UML diagrams for ABAP Classes
- Generate relationship diagram between different ABAP objects
- Documentation of diagram elements
- View ABAP Code
- SAP Solution Manager Ready
8. Software requirements
- Operating System, Front-End PC: Windows® NT 4.0 / 2000 / XP® / Vista® / Windows® 7
- SAP® system: SAP® R/3® 3.x to 4.7 (R/3® Enterprise), mySAP™ ERP, SAP Netweaver™ 6.10 to 7.30, SAP® APO, SAP® BW, mySAP™ CRM, as well as all further components which are based on SAP Netweaver™.
- SAP® GUI for Windows® : Current release from 6.203 on
- Standard interfaces: ‘BC-MID-RFC’ (SAP® RFC) and ‘BC-FES-SCR’ (SAP® GUI Scripting, activated profile parameter ‘sapgui/user_scripting’) installed during the SAP® GUI standard installation.
- Activated profile parameter ‘sapgui/user_scripting’ (see SAP® Marketplace: SAP® Note 480149). A detailed tutorial can be found in our help file (Installation guide -> Notes for administrators).
- During the installation an authorization key for the CT-Module has to be entered.
9. Hardware requirements
- Processor: Minimum 500 Mhz
- Main memory: Minimum 256 MB
- Graphics card: 65,000 colors or higher
- Monitor: 17 inches, 1024 x 768 or higher
- Disk memory: approx. 68 MB


![UML Diagram [Classes] - Excerpt](http://www.ct-software.de/wordpress/wp-content/uploads/2013/02/cvi-abap-uml-diagramm-class-300x246.png)
