CT-Debug & Trace Module …
In future, testing and debugging of ABAP® programs will be easier, simpler, and more effective …⇒ Time-consuming single step debugging is a thing of the past.
With the CT-Debug&Trace module, you can automatically record the processed program flow of ABAP® programs and transactions and can then analyze the program flow at any time (even during debugging sessions).
You can archive the trace recording of programs, transactions, function modules, methods, and so on and can analyze it later (after a week, month, year …) using the values for the relevant variables (to check program changes, for maintenance, documentation …).
Automated debugging support allows you to:
– Browse backwards LIVE in backtrace mode during the the debugging session
– Analyze the content of a variable that has been processed
– Check the source code commands per step
– Gain a clear picture of the trace data pool using more than 20 reports
– Configure a debugging session using more than 10 debug profiles
– Analyze an archived debug recording again to find an error that has just occurred
The Use of Certified Software = Secure Applications for Your Company…
Knowledge of the technical relationships, e.g. in the Repository, ABAP Dictionary, program/class library and of the base programs and system interfaces forms the basis for the substantive analysis and documentation of ABAP code. The prerequisite for developing our CT products is the considerable know-how and many years of experience (more than 30 years) of our development team.
The security of your company’s applications is supported by the certification of the CT-AddOn by the manufacturer of the ERP software. This certification confirms that interfaces are used correctly, that add-on functions are relevant to the process, and that technical implementation is correctly done. Your add-on product has undergone system integration tests within an ERP environment.
You receive an add-on product for which system integration tests have been carried out within your ERP environment. Certified software products significantly enhance your IT security.
Increasingly, company compliance rules call for the use of certified software. In addition, using certified software simplifies regular system checks by internal and external auditing bodies, e.g. government tax audits, external audits, internal audits.
SAP SE certified the CT-Debug &Trace_Modul on 21.04.2011 …
Application Areas of the CT-Debug & Trace Module
1. Documentation of the processed commands and variables …
2. The manual debugging with automatic trace documentation …
3. The Back trace mode – back stepping on the Frontend-PC …
4. The variables are automatically determined and their content is documented …
5. Controlling the debugging session through debug profiles …
6. The analysis mode with 20 interactive reports …
7. Type & coverage of the documentation of a debugging session …
8. The intensive and thorough testing of programs …
9. Separating documentation from analysis in debugging …
10. Further Add-on debugging functions …
11. Sophisticated Trace Functions …
12. SAP Certification …
1. Documentation of the processed commands and variables …
The time consuming traditional way of debugging (F5, F6, F7 etc.) will be done in the future automatically by your PC. You can now concent
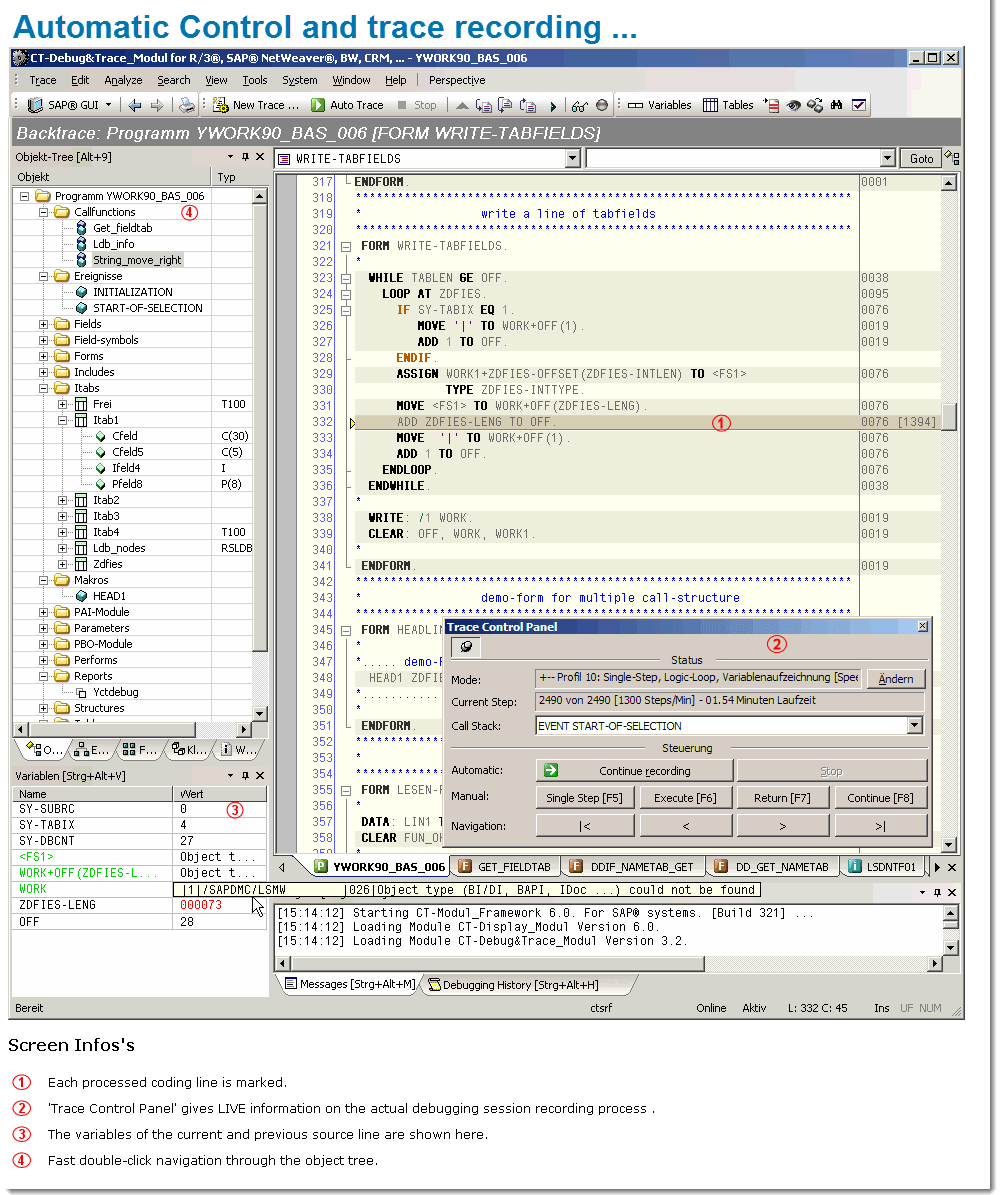
Automatic Control and trace recording
rate on the really important coding lines.
So, leave the routine debugging to your PC. It is a lot quicker than you (much quicker , approx. 1000 – 1500 debugging steps/min.).
2. The manual debugging with automatic trace documentation …
You can stop the automatic debugging and carry on with manual debugging and change back to the automatic debugging at all times. Because every machine or manual step is documented, an analysis of the previous debug steps is possible.
Additionally, all processed source code lines are marked, so you can see which line was executed and which not.
Optionally, the synchronized SE38 debugger screen (classic ABAP Debugger) is made available at the current coding place.
3. The Back trace mode – back stepping on the Frontend-PC …
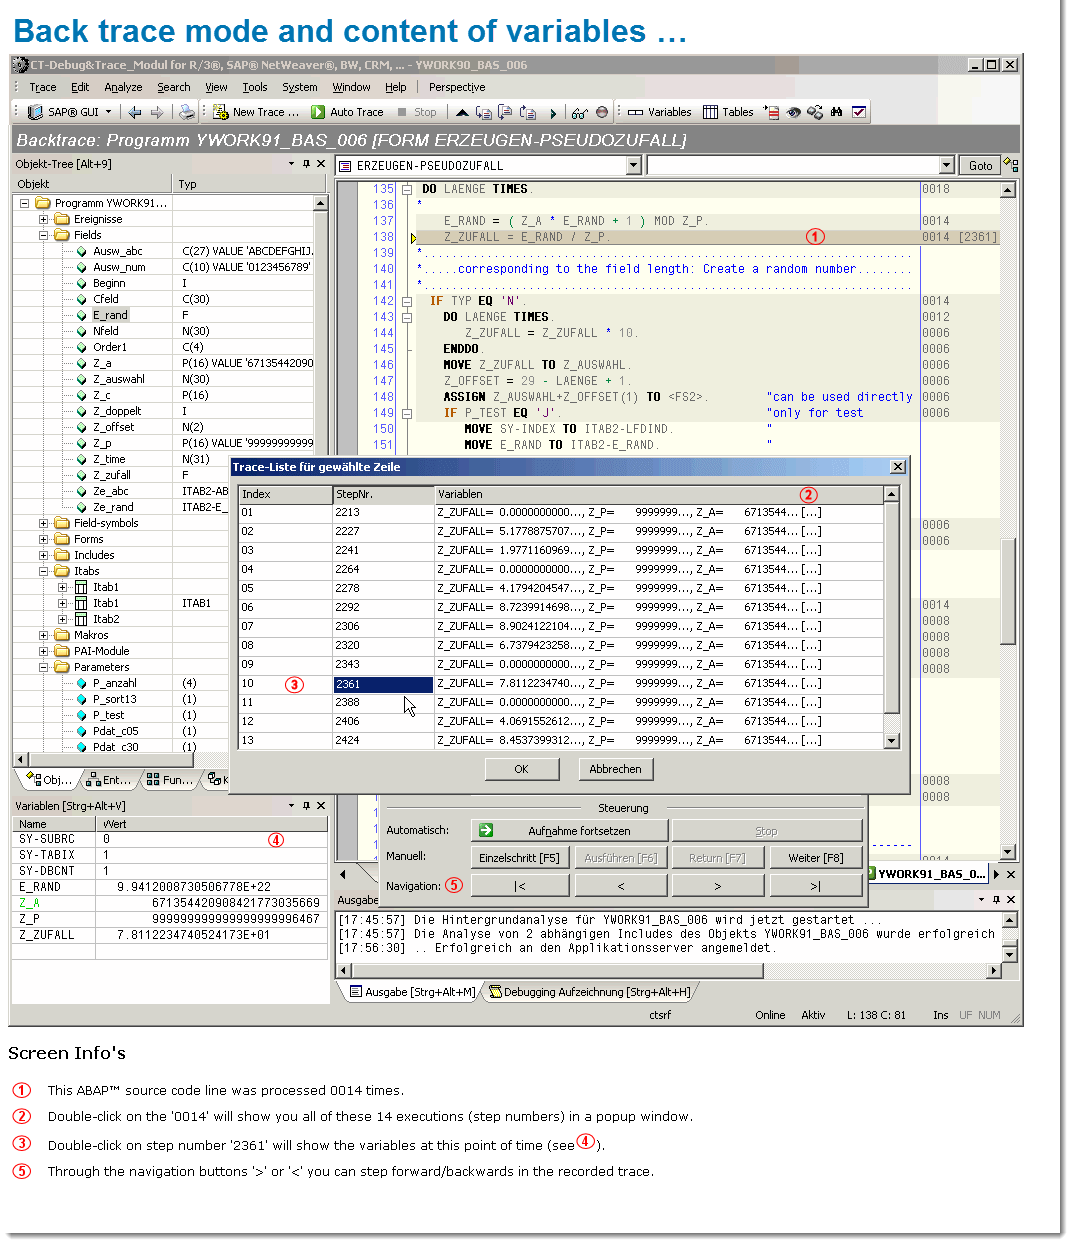
Back trace mode and content of variables …
The CT-Debug & Trace_Module makes an offline-trace available on the frontend PC. You are thus able to step forward & backwards through already processed coding parts and at the see the corresponding contents of the processed variables at that time.
Also during a still active debugging session, you are able to e.g. test a relevant coding part again …
4. The variables are automatically determined and their content is documented …
The variables of each processed coding lines are automatically determined. Then two snapshot of these variable are carried out: Before and after the execution of the coding line. So changes of the variable content are automatically recognized and also part of our trace documentation (max. 24 variables/command).
If you for example want to test if certain subroutines (FORMs, FUNCTIONs, METHODs etc.) were correctly executed, just have look at the trace documentation: All subroutine parameters (single fields, structures) before and after the call were saved.
5. Controlling the debugging session through debug profiles …

Debugging of large programs …
The transcription of your debugging session will be supported considerably through 11 debug profiles.
You control through a choice of a suitable profile the details which are recorded during the debugging session. You can for example let the CT-Debug&Tracer record each executed ABAP source lines (single step), or you can e.g. just record all subroutine, function module and method calls (with their parameters).
The program flow of large programs (e.g. transaction) is made transparent and important events and variable contents can be easier identified (compared to the classic .
You can also record only certain ABAP source code parts of a transaction (shown in our manual – section ‘Tips & Tricks’). An example would be the processing of only one given transaction screen or a special user exit. After reaching the desired source code include, just use one of our debug profiles to process it and document every step (with the contents of the variables).
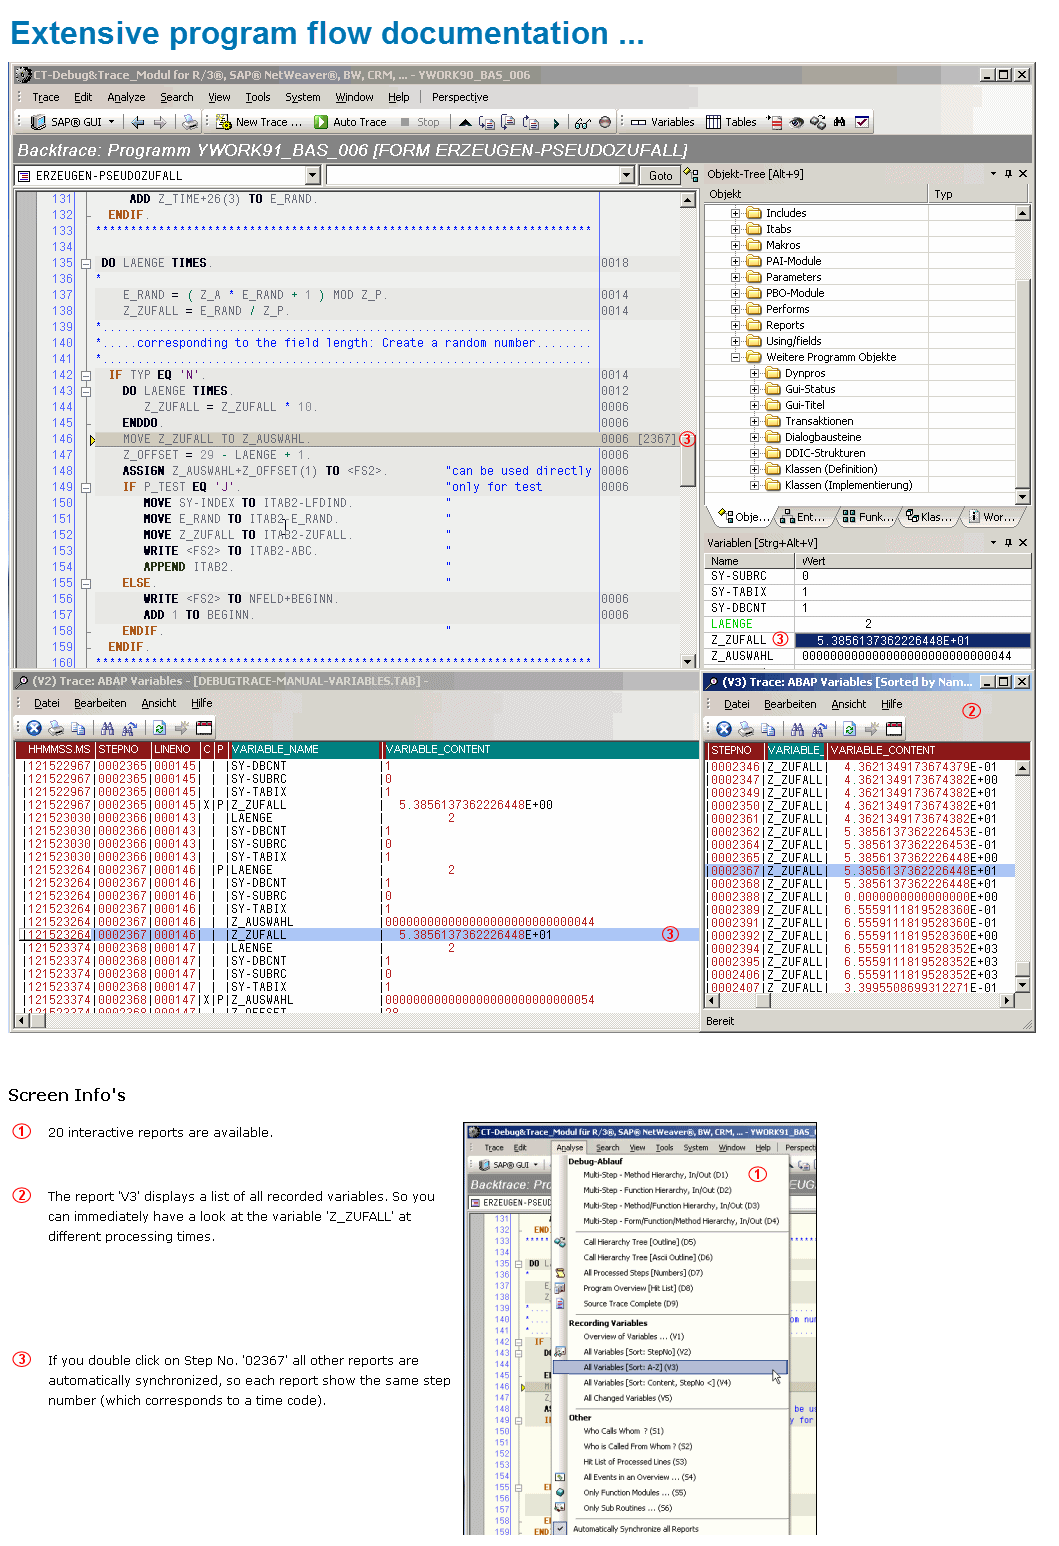
6. The analysis mode with 20 interactive reports …
Central component of the trace data analysis is the integrated report engine which was designed to handle large amounts of trace data. One important report is the debugging tree, which gives a quick hierarchical overview on the recorded debugging session (processed FORMs, FUNCTIONs, METHODs …).
With a double click on a tree element, you can jump to more detailed data. In the analysis mode more than 20 interactive reports are offered, and all reports are synchronized with the recorded debug session (cockpit information)..
7. Type & coverage of the documentation of a debugging session ….
 During an automatic debugging session of approx. 10 minutes, you can e.g. automatically document more than 10,000 single program steps, by using our single step trace profile. Additionally, approximately 20,000 variables with their contents (and content changes!) are recorded in that time. No user activity is necessary here.
At the same time all processed ABAP coding member from the application server program library (e.g. 100 ABAP includes, when tracing approx. 30,000 coding lines) will be stored in our offline database for later analysis, control and documentation purposes. So you will get a consistent documentation of the program flow.
The processed source code lines are marked in color and additionally are synchronized with all our interactive trace reports.
8. The intensive and thorough testing of programs …
Through the auto-debugging feature (with is control through debug profiles), you can process your program and extensively test it in a short time. The automatic documentation of each debugging step can later be added to the technical program documentation as a test protocol.
It is therefore possible, at a later time , to browse forward and backwards in the offline-mode. You will an interactive documentation of your program flow at a specific time, which can be (re)processed at any time in the future (without any connection to the application server). So if an ABAP® source is changed or deleted in the future, the trace documentation will stay consistent.
9. Separating documentation from analysis in debugging …
The possibility to automatically record the complete program flow in a short time, leads to a more efficient course of work with the testing of programs and the solving of bugs:
- To start with, the debugging session is documented (your PC does this for you in the background)
- This followed by an analysis which is supported by the dedicated reporting features.
Also consideration has to be given, that the complete program flow is automatically part of the documentation, which includes access to control, master und other data tables and the used test data.
You can then process the exact recorded program flow at any time with our offline trace feature. In contrast: It is often quite difficult to reproduce the exact program flow manually (e.g. database tables were updated during the last test run).
10. Further Add-on debugging functions …
- LIVE information on the actual debugging session recording process through the ‘Trace Control Panel’
- Ability to go back to already processed program lines at any time (back trace feature), even after a short dump
- Code folding feature (outlining) makes it easy to understand large programs (e.g. a large CASE statement can be folded and unfolded directly in the debug session
- Trace pool for the reconstruction of, test data, the program flow, situations were errors occurred
- Syntax highlighting of ABAP® sources (report, program, function module, classes …)
- Object browser (programs, classes, function groups, structures …) can e.g. search for certain variables
- Work space tree of the actual processed source code member, a history of the session
- Multi search functions with regular expressions, the result can be displayed in multiple windows
- Display of tool tips when placing the mouse cursor of certain coding coding part (e.g. declaration data of variables is displayed)
- Modern eclipse like user interface, each gui element can be individually arranged, these window arrangement can be saved and restored as a perspective …
11. Sophisticated Trace Functions …
In theory, even “small” ABAP programs can process more than 100,000 individual steps (e.g. SELECT, DO, WHILE, LOOP). If you want to analyze part of an ABAP program that is of interest to you, you can actively change the level of detail of the trace during the debugging session. More than 10 debug profiles are provided for this.
Conclusion:
You can locate a program error relatively quickly (multi-step profile) and then record the problematic section of code automatically using a single-step profile. You can then analyze the code with the help of 20 interactive reports.
12. SAP Certification…
SAP SE certified the software solution ‘CT-Debug&Trace Module’ on 21.04.2011.

SAP Zertifikat: CT-Debug&Trace_Module
Certified Functions:
- Debugging of ABAP Code for program or transaction
- Trace recording of the processed ABAP® commands and variables
- Advanced forward/backward stepping through proceeded coding
- Online/Offline debugging
- Interactive list reports of call hierarchy and recorded variables
- Export recorded trace to test & optimizer (for automated graphic program flow)
- SAP Solution Manager Ready